Design risk. Connected.
See the system.
Understand the risk.
Move your DFMEA beyond the spreadsheet. See how failures connect, focus your reviews and give every risk a next step.
For engineering teams, reliability leaders and DFMEA consultants.
Every component.
The bigger picture.
A second perspective
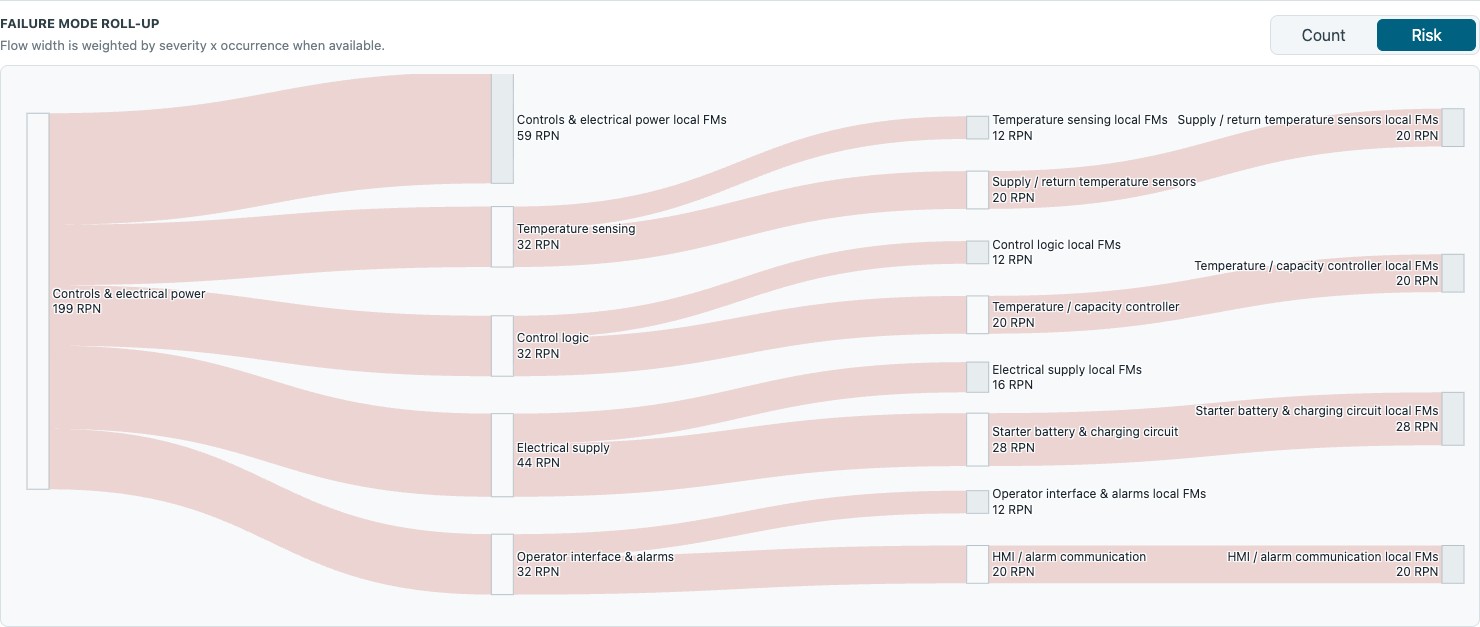
See where risk concentrates.
Follow risk across systems, subsystems and components. Weighted flows reveal where to focus your next review.
Less friction. More engineering.
Keep the detail.
See the bigger picture.
One visual workspace. Parallel workstreams. Collaborate on the same system, tackle different areas independently, or explore a separate project copy.
Start with the DFMEA
you already have.
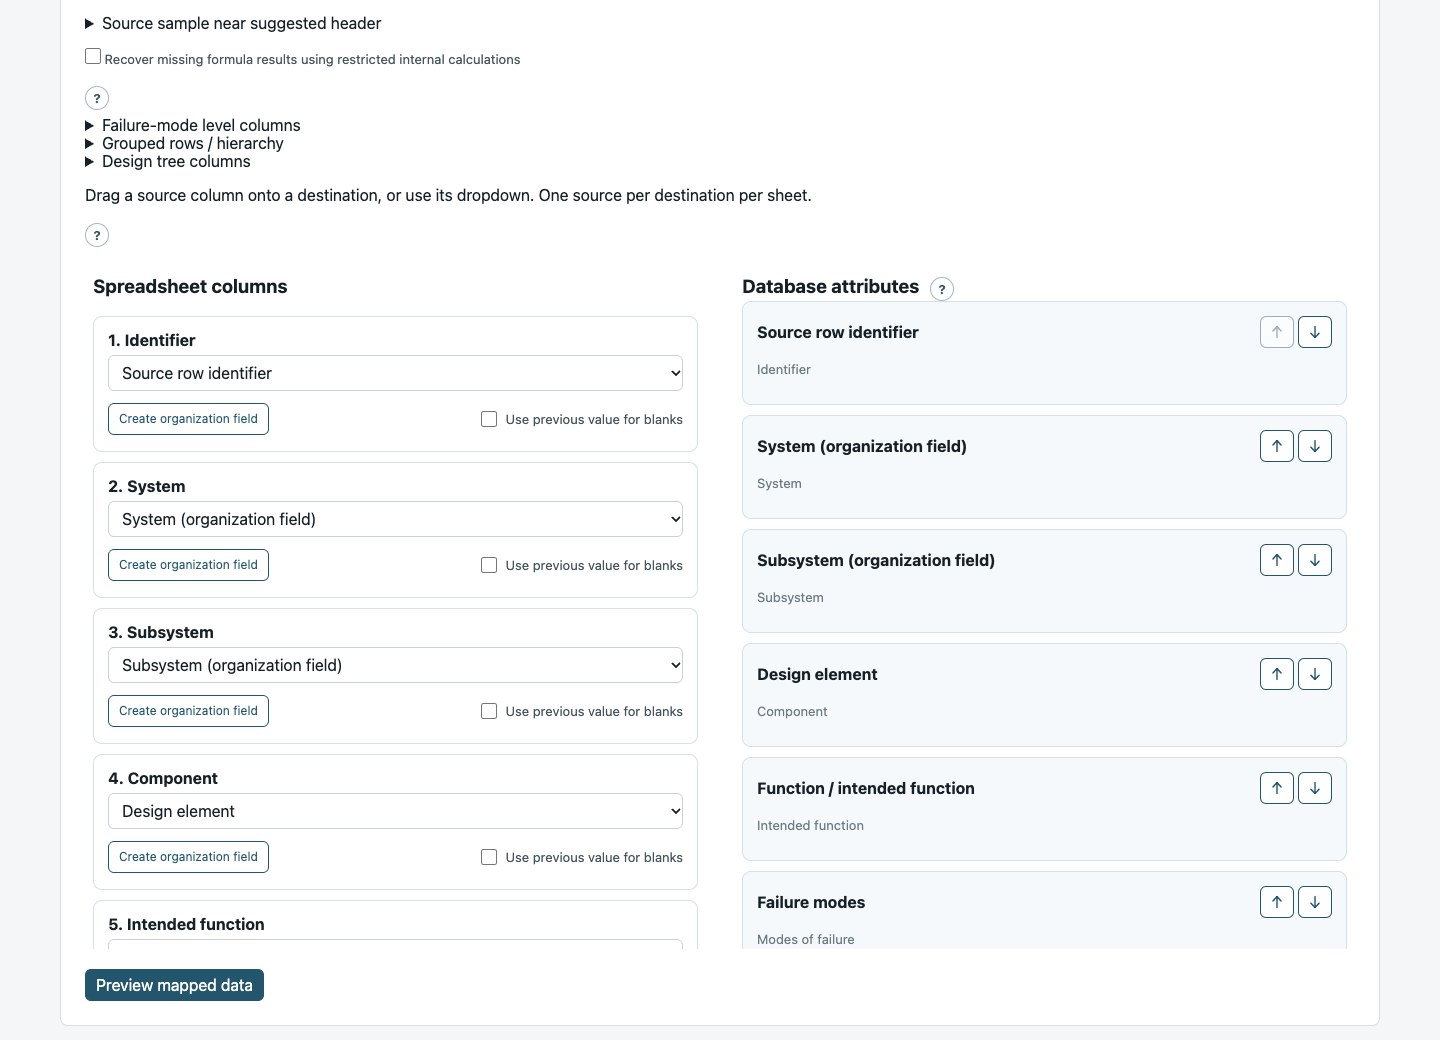
Bring legacy analysis forward. Review column mappings and reuse saved risk definitions from past designs.
- Reviewable column mappings
- Custom fields for your organization
- Optional AI-assisted import
Review first. Import when ready.
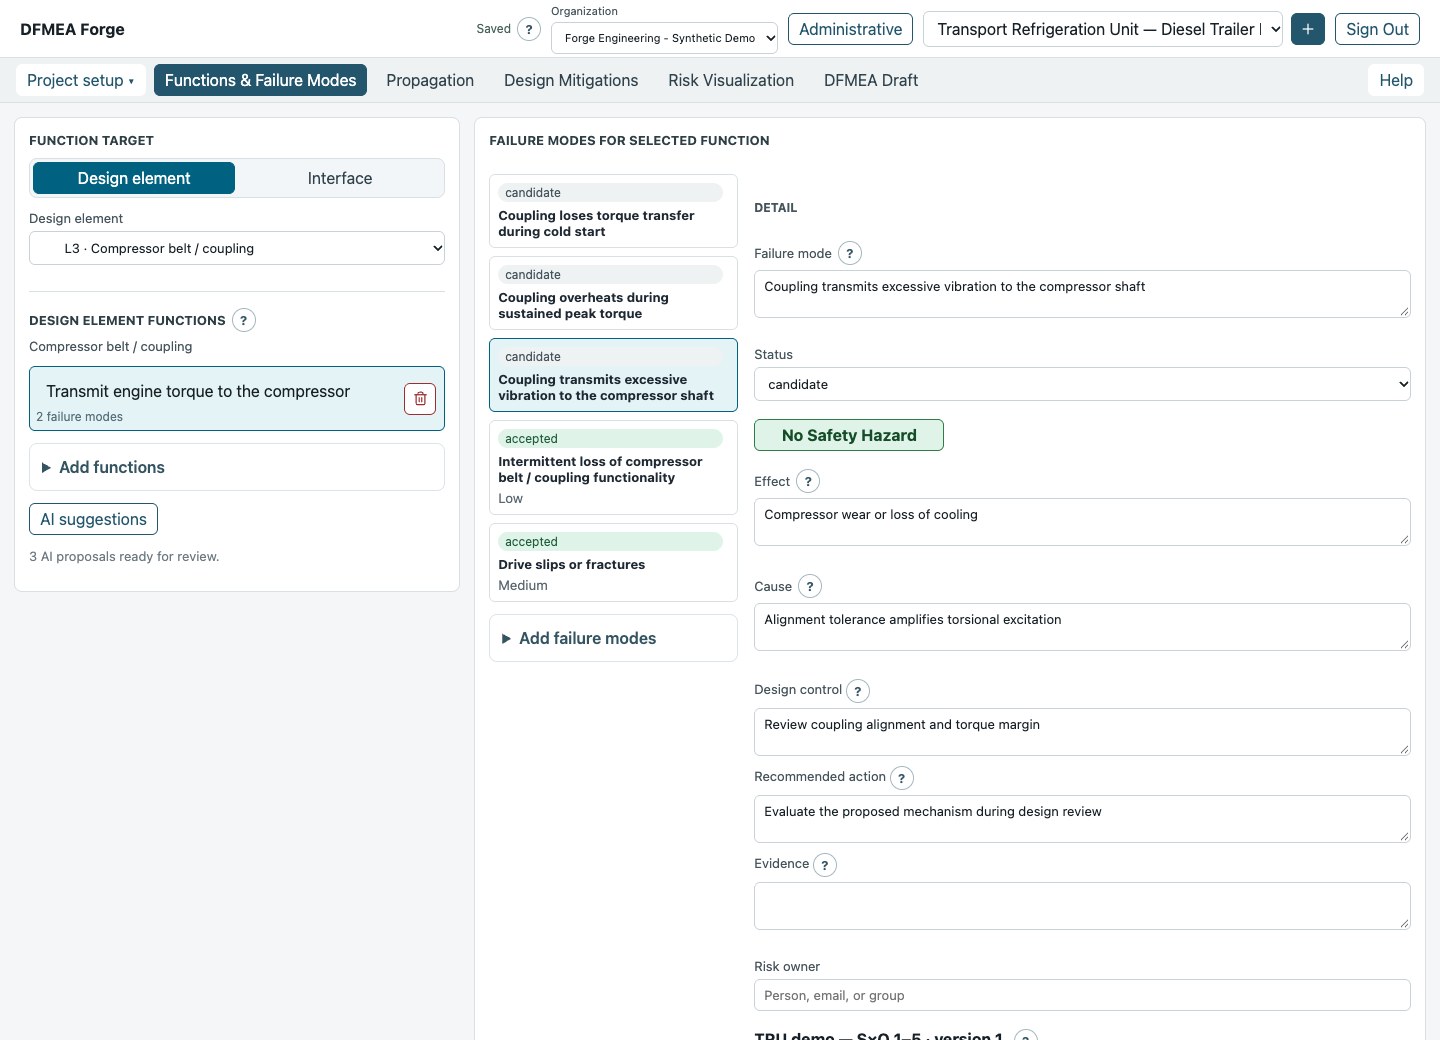
Every component.
In context.
Build and reuse across every design layer—from the whole system to subsystems and individual components.
- Multi-level design hierarchy
- Component and interface functions
- Reuse across projects
Start fresh or build on prior work.
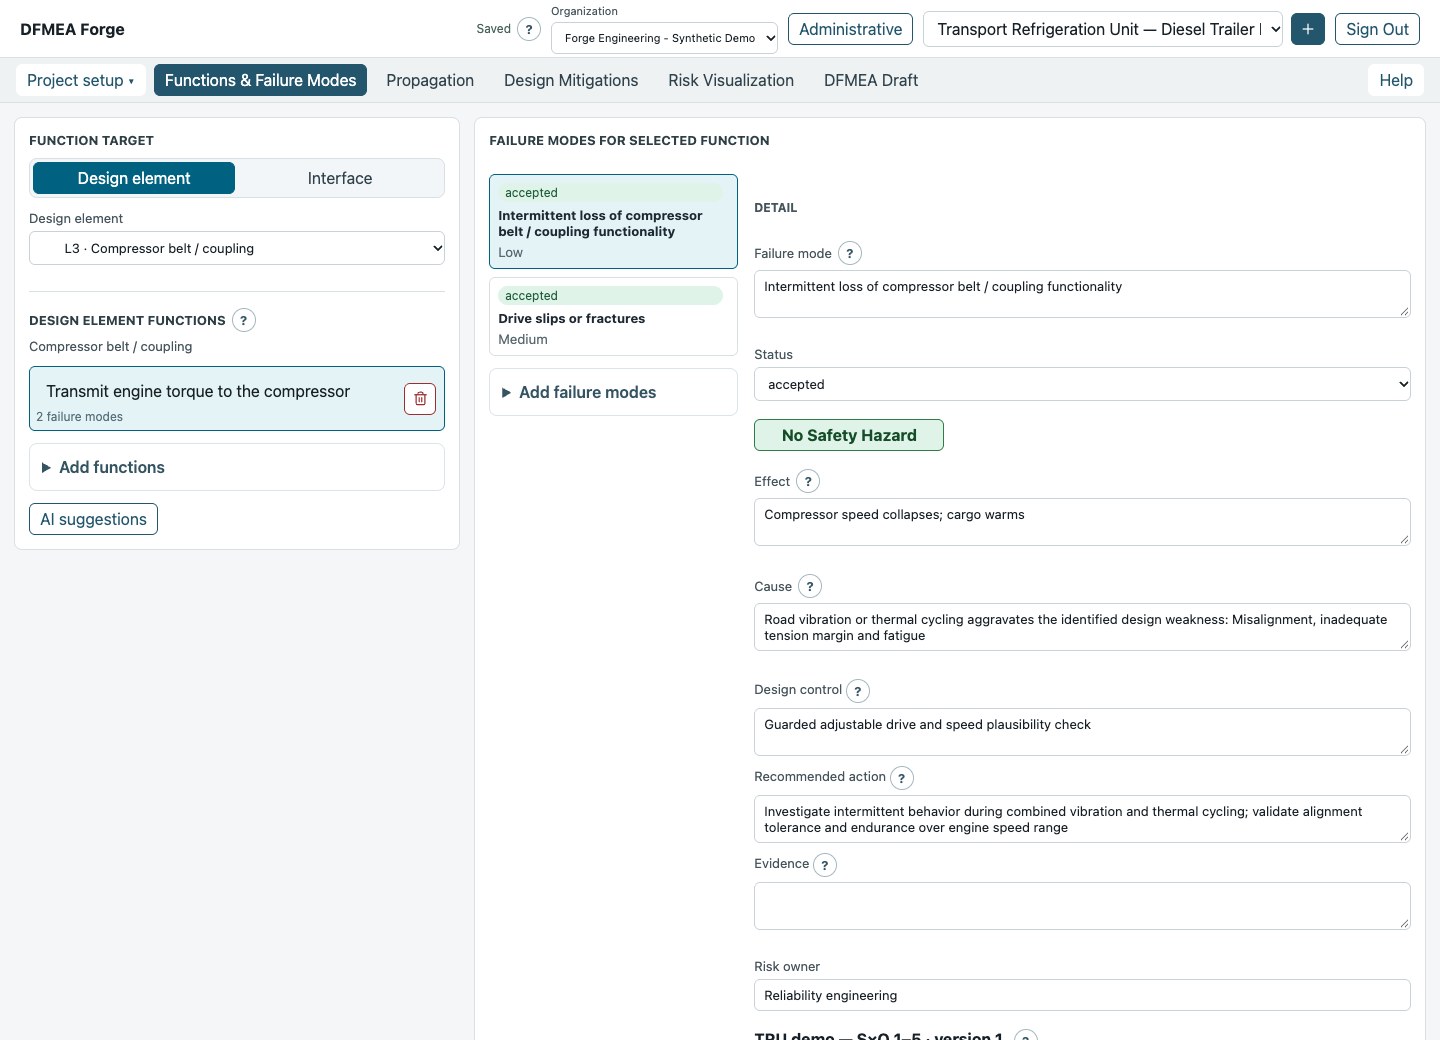
What should it do?
What could go wrong?
Link functions, failures, causes and effects. Use optional AI suggestions to broaden the discussion—not replace engineering judgment.
- Traceable functions and failures
- Initial and residual scores
- Controls and evidence in context
Your team makes the call.
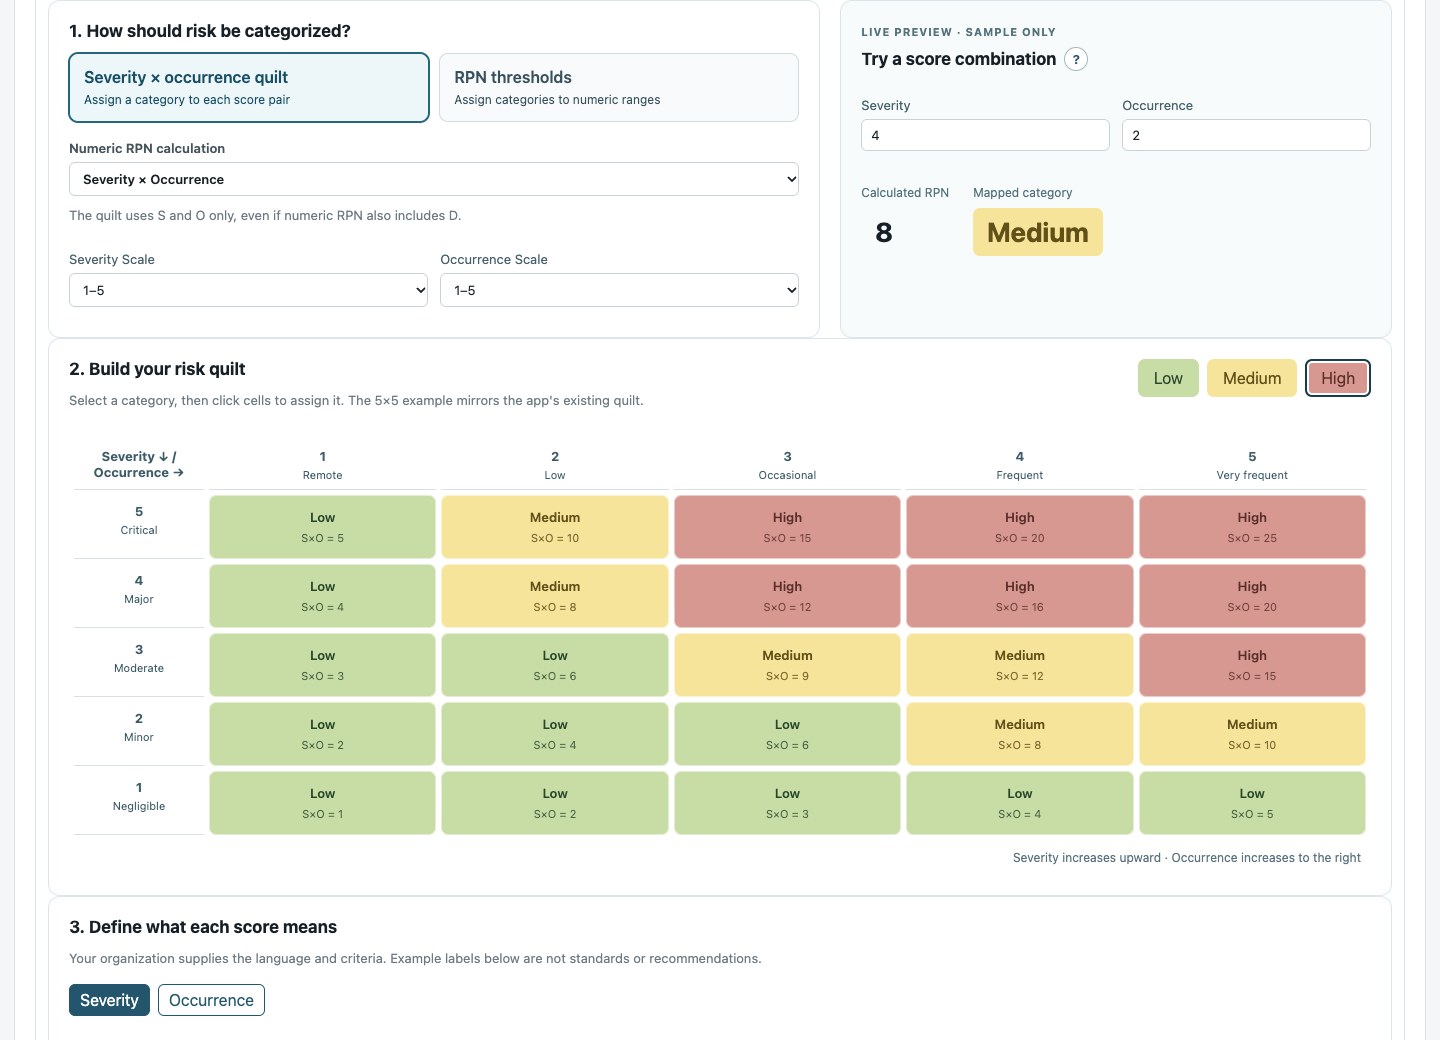
Your risk method.
Not a forced fit.
Fit the scoring to your process. Define your scales and risk categories, then save the method with the project.
- Severity × occurrence quilts or RPN bands
- S × O or S × O × D
- Reusable scoring systems and definitions
Review changes. No silent score conversions.
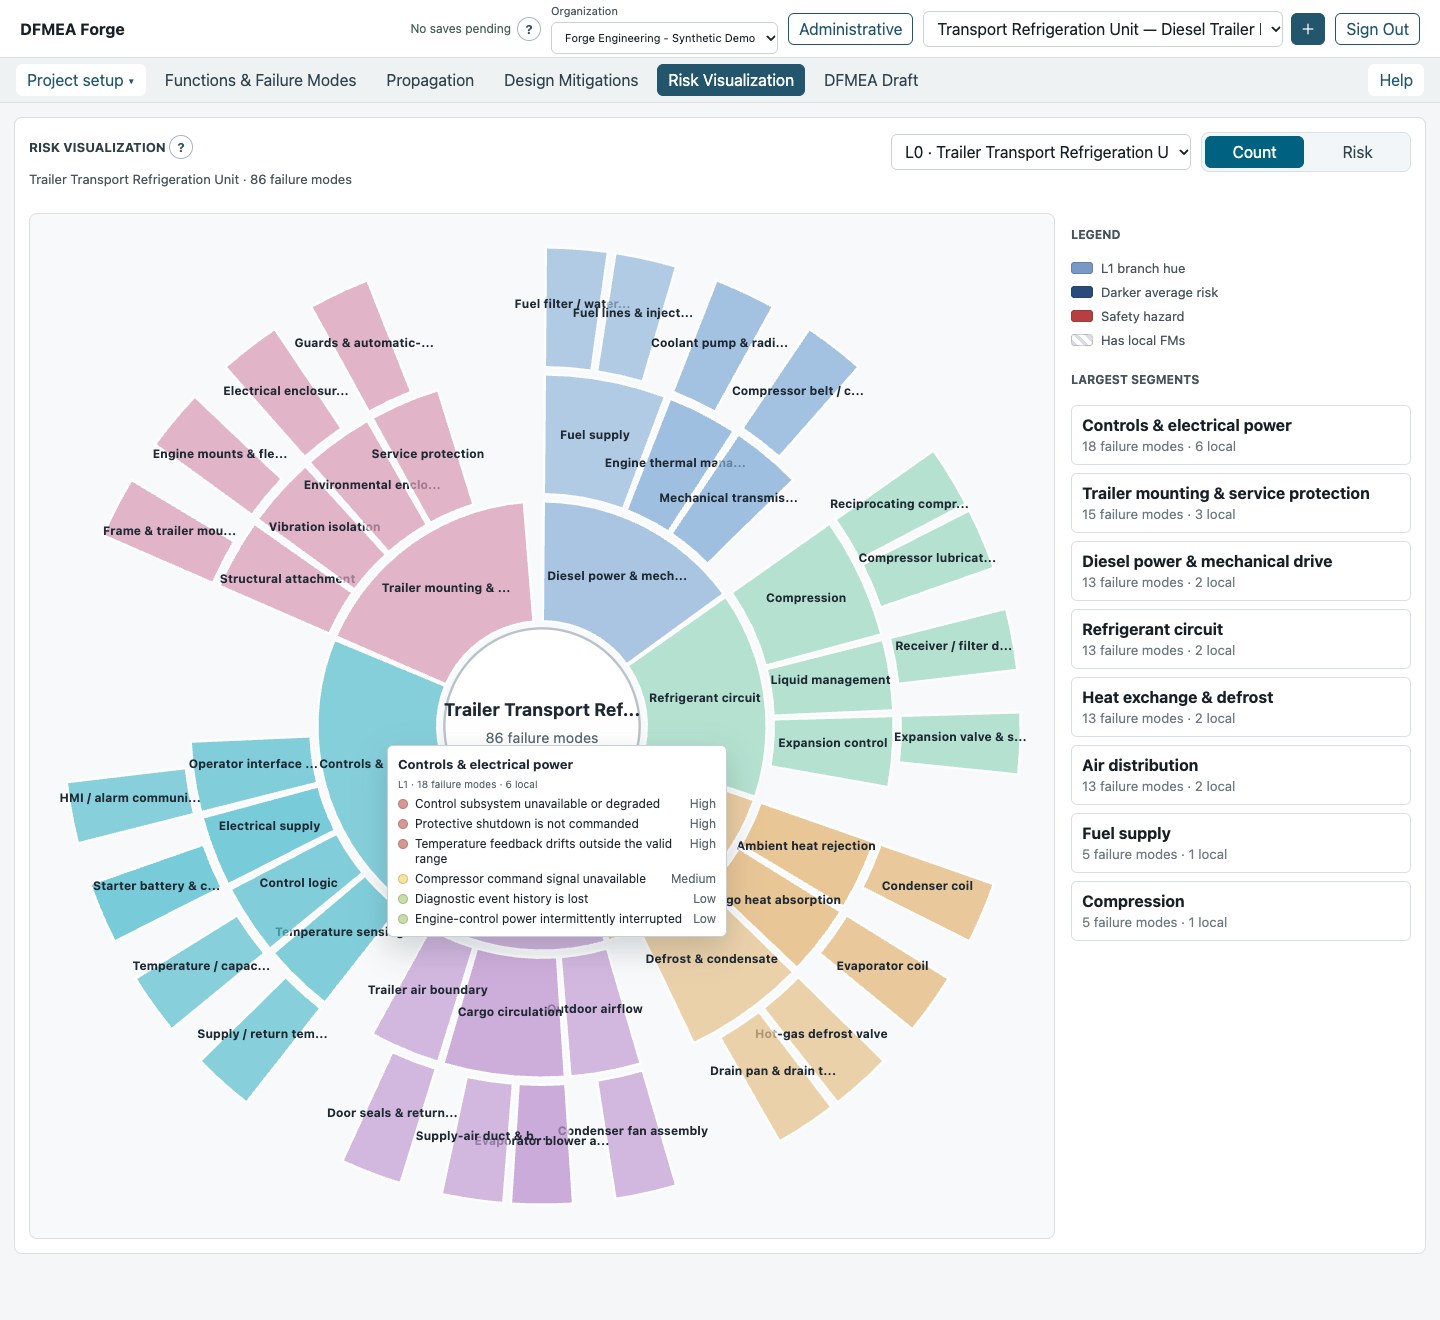
See the risk.
Not just the rows.
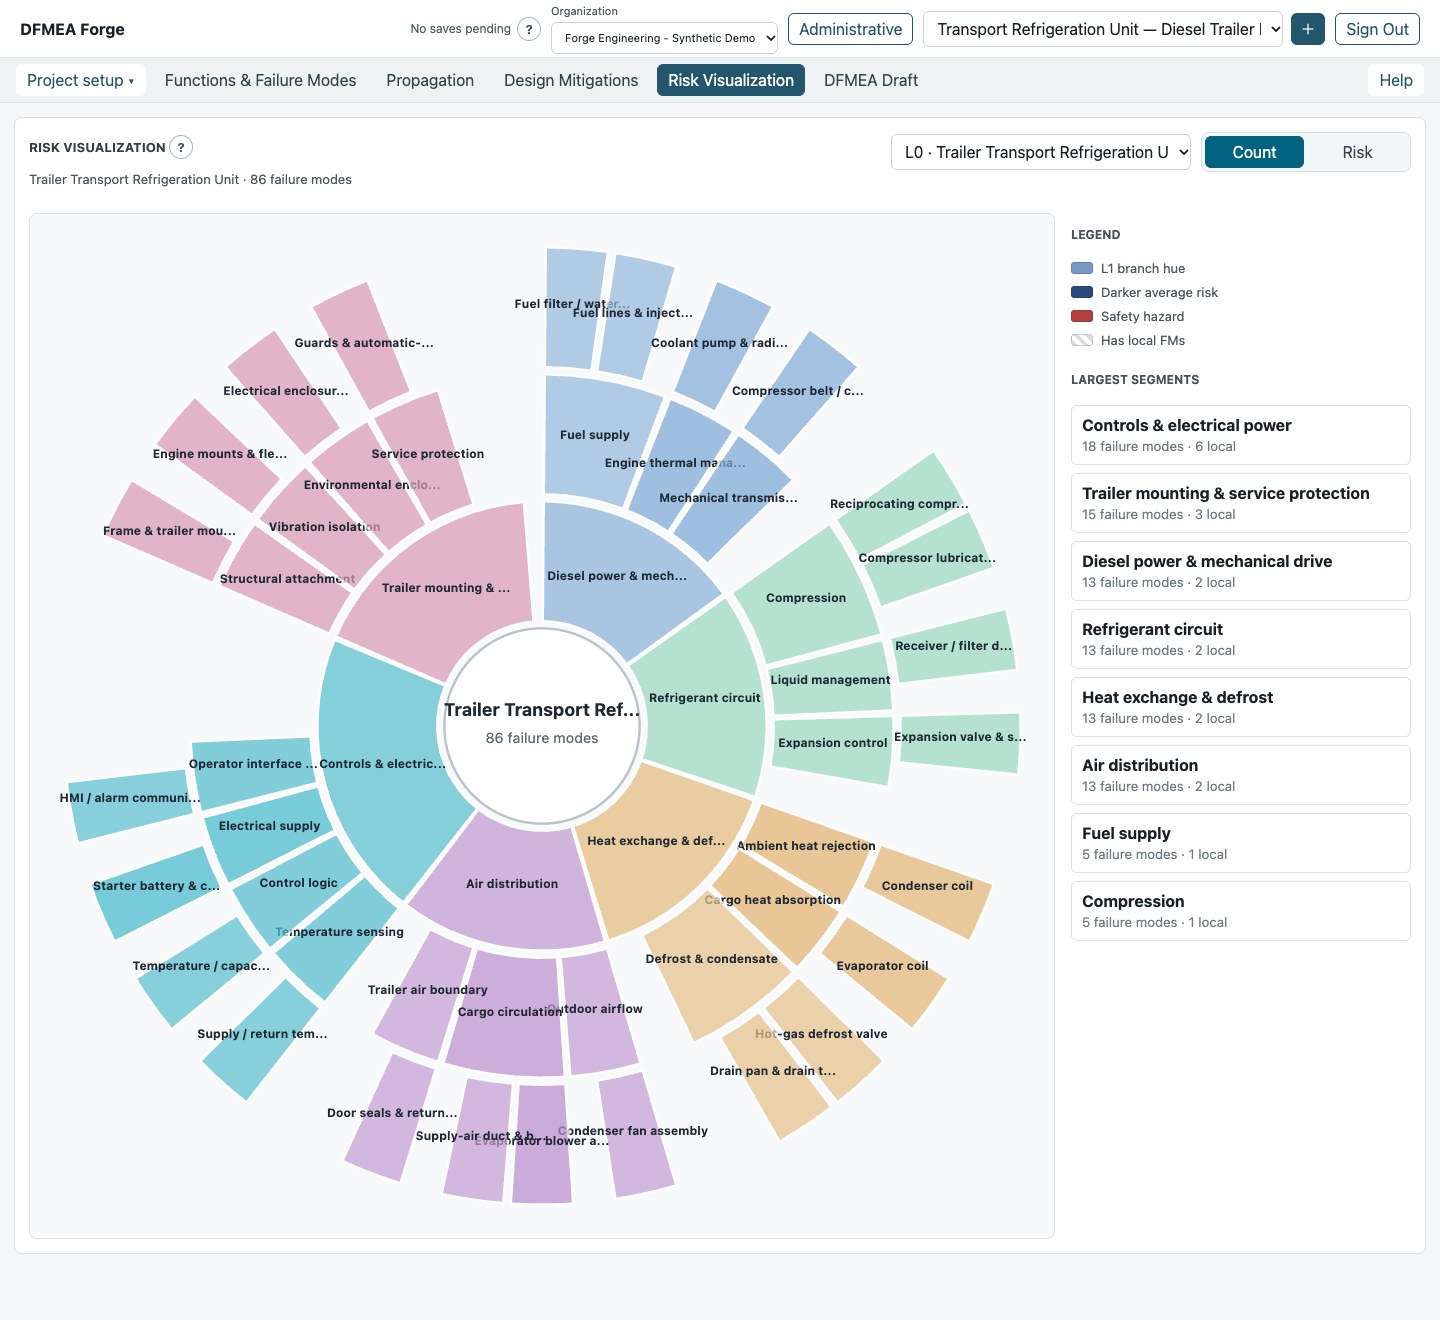
Explore risk across design layers. Hover over a system or component to inspect its local failure modes and risk levels.
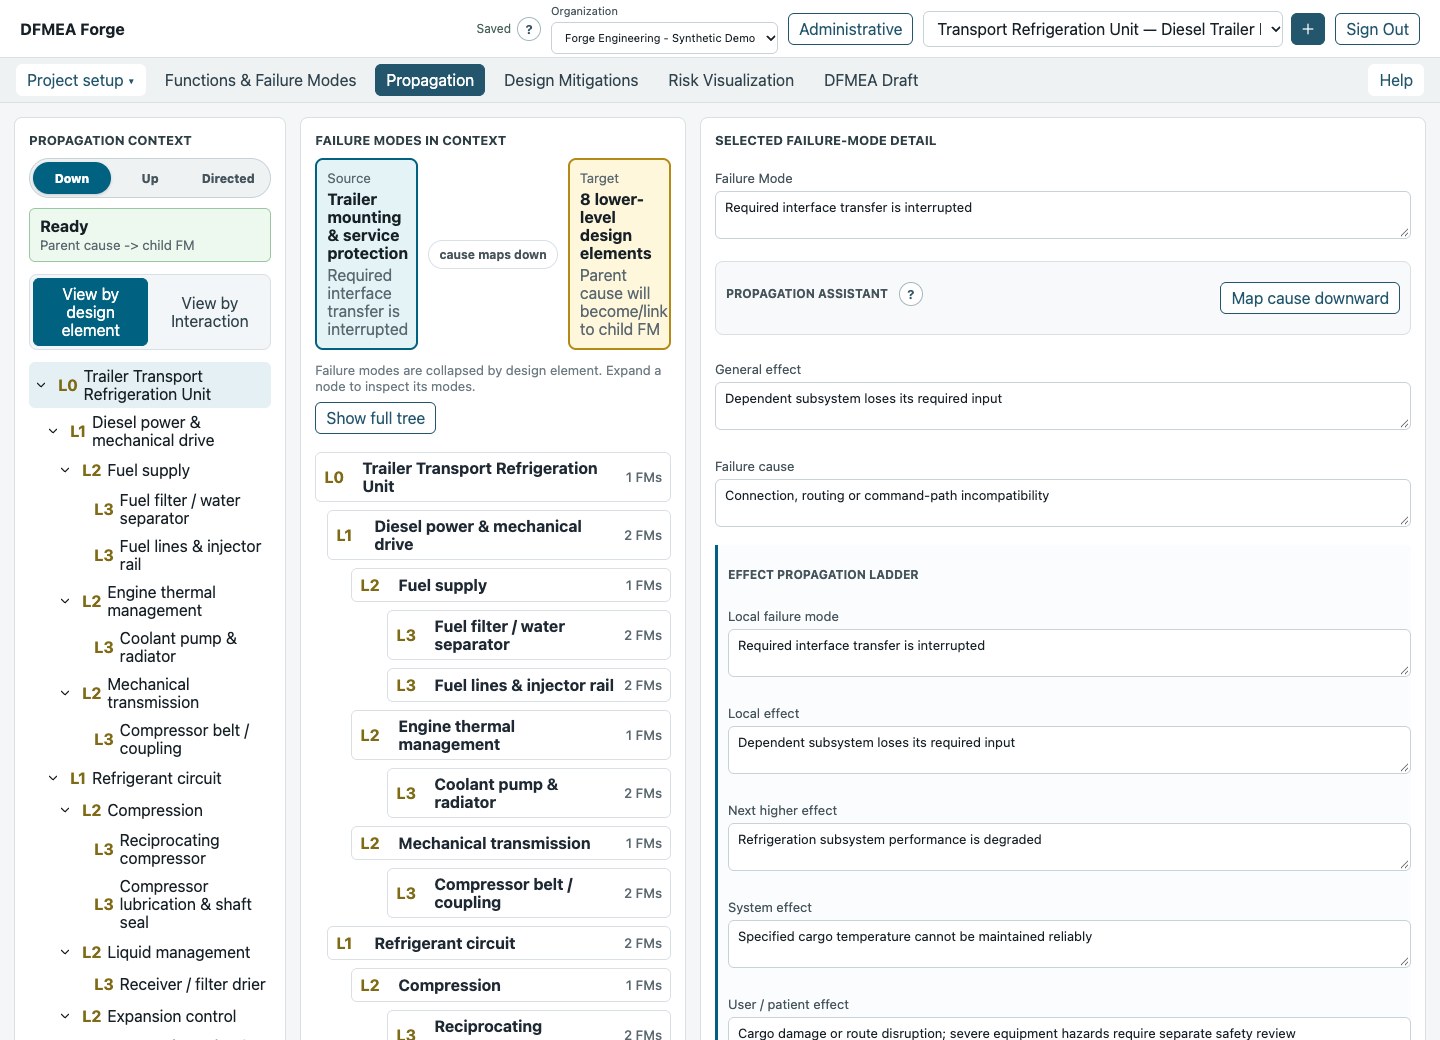
See where a failure
can lead.
Trace how failures propagate through the design—and make the reasoning behind each connection clear to the team.
- Parent–child failure links
- Local, system and user effects
- Traceability across design levels
Keep the why behind the score.
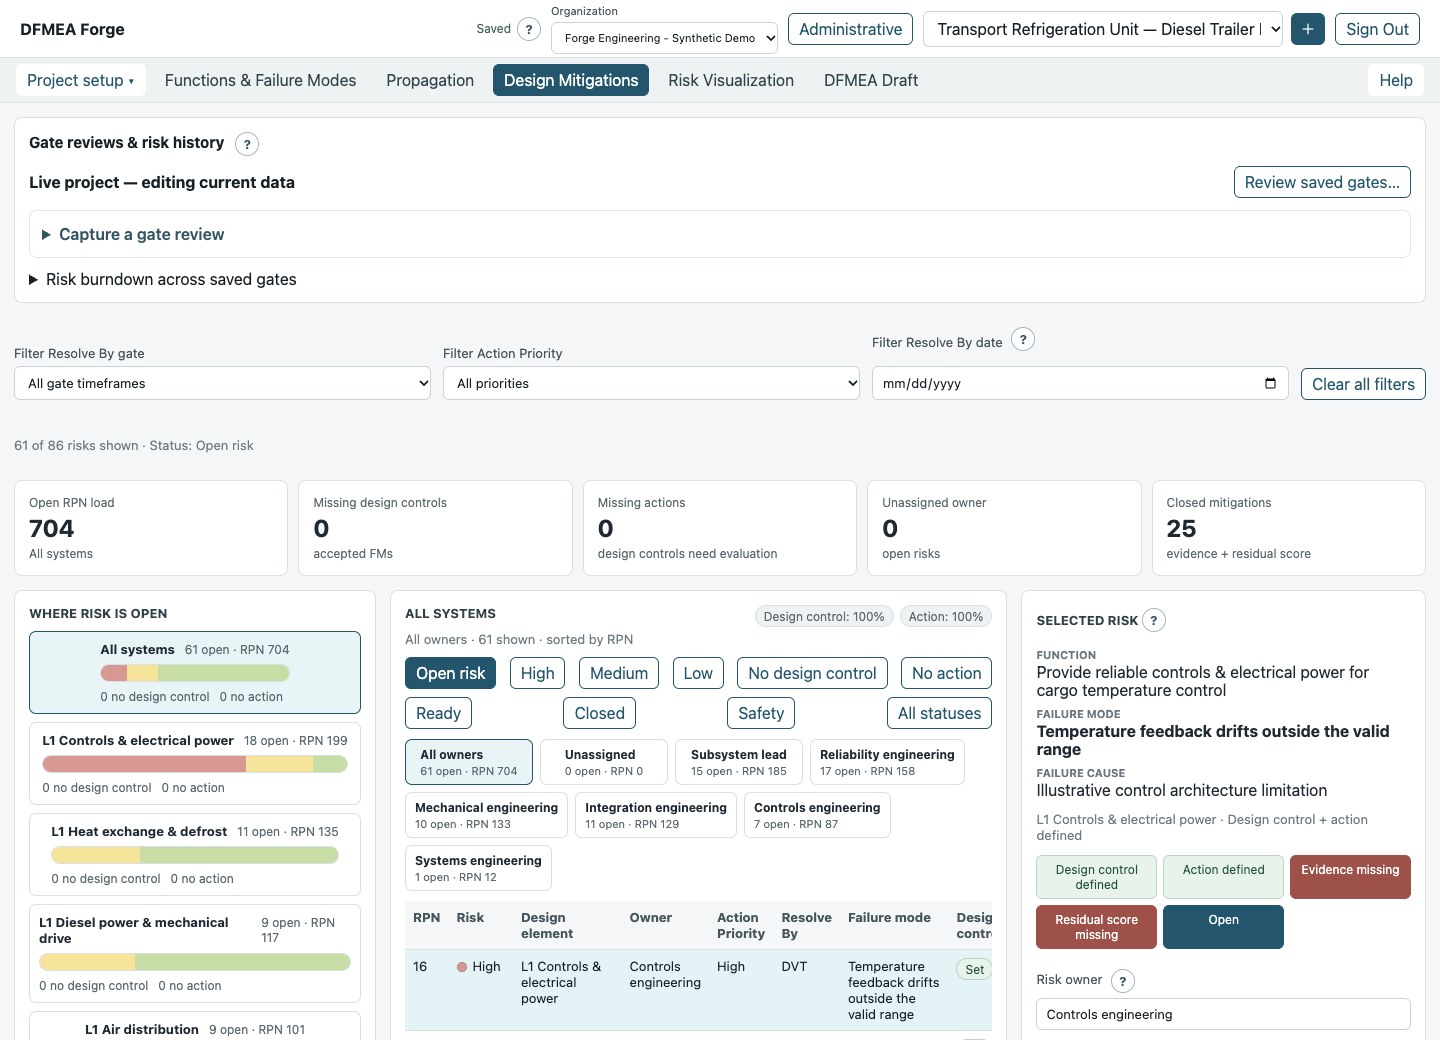
Give every risk
a next step.
Move from discussion to ownership. Assign actions, deadlines and project gates, with evidence and residual scores close at hand.
- Owners, priorities and deadlines
- Filters for focused reviews
- Evidence and residual scores
Track the action. Keep the evidence.
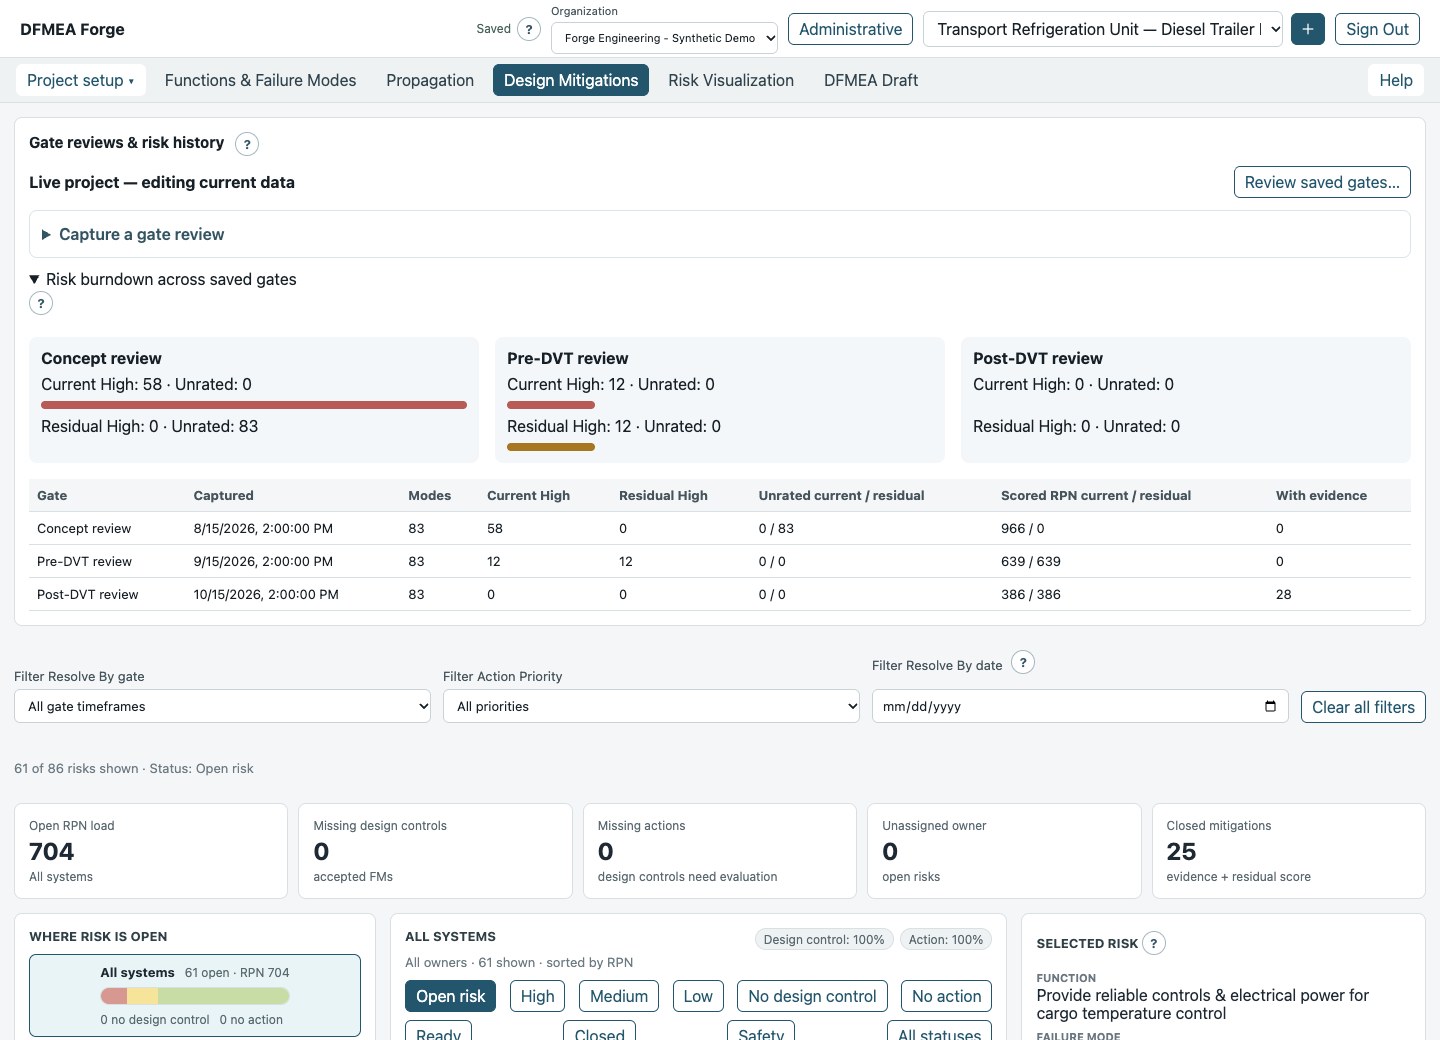
Show the progress.
Keep the history.
Save the review, keep the project moving. Revisit scores, definitions and evidence at each gate—and see how risk has changed.
- Named, read-only review snapshots
- Risk burndown across saved gates
- Live editing between reviews
Know what was reviewed—and when.
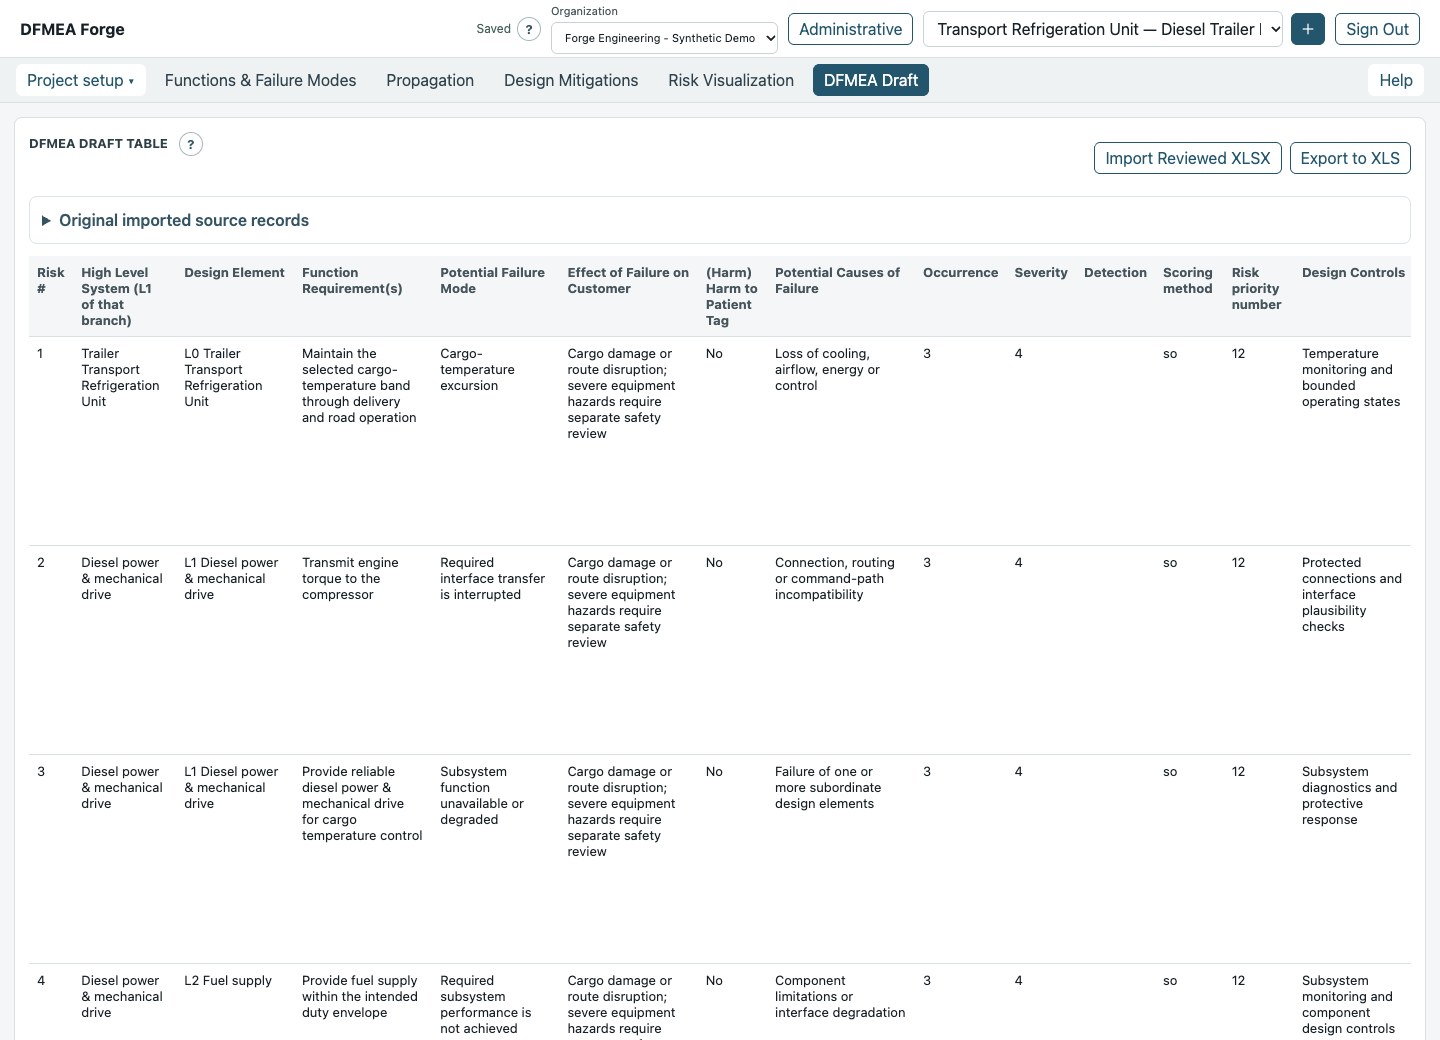
All the detail.
Ready for review.
Keep the familiar DFMEA table, connected to the analysis. Review accepted failure modes and export a spreadsheet when you need it.
- Functions, failures, causes and effects
- Scores, controls and owners
- Spreadsheet export
Go visual. Go detailed. Stay connected.
Work together. Keep boundaries clear.
A shared workspace.
Clear boundaries.
Your organization’s workspace
Projects, custom fields and settings stay scoped to your organization.
The right access
Admin, Super User, Reviewer and Viewer roles.
AI on your terms
Admins control AI features. Your team reviews the suggestions.
A clearer path from design to review
Bring it in.
Move it forward.
- 01
Bring your design
Import a spreadsheet or start fresh.
- 02
Build the analysis
Connect functions, failures and your project’s scoring.
- 03
Drive the review
Assign actions, gather evidence and capture progress.
A few useful answers
Good questions.
Straight answers.
Who is DFMEA Forge for?
Engineering teams, reliability and quality leaders, and DFMEA consultants—especially small and midsized organizations moving beyond spreadsheets.
Can we bring our existing spreadsheets?
Yes. Map columns, keep custom fields and review before importing. Check unfamiliar layouts and formula results; macros never run.
Does AI make engineering decisions for us?
No. AI can suggest mappings and analysis. Your team reviews the output and owns the engineering decisions.
Is this a regulatory compliance or certification tool?
Not a certified regulatory-recordkeeping tool. Don’t upload patient information, protected health information or other prohibited regulated personal data. Peer reviews use synthetic or expressly approved nonsensitive material.
How do we get access?
Request early access to tell us about your team. Access is invitation-only; an inquiry won’t create an account or subscription. The form is currently a preview.
Your next DFMEA starts here.
Less friction.
More understanding.
Bring your team’s toughest DFMEA challenges.
Help shape a better way to work through risk.